Merrick Howarth
Monday, November 25, 2013
Conclusion
In the past weeks of our soil lab and blog, I have learned about the extensiveness of soil and its importance. Throughout the lab we discussed the importance of s healthy and fertile soil in many things like the agriculture industry. Soil is influenced by five factors its parent material, climate, time, biota, and topography. All of these factors influence how fertile the soil is. I not only learned that there are many different types of soil, due to the many variations of each factor, but I also learned that some soil types are far better do growing plants than others. For instance, a soil that is loam, or a proper mixture of silt, clay, and sand, will filter water and hold nutrients for a plant better than a sand heaven soil because the sand heaven soil will experience more salinization. I also learned thy soils that are to as fertile can have components added to them to make them more fertile. If a soil does not have enough nutrients a person can add a fertilizer to help the soil support plants life, but the type of fertilizer is significant depending on your soil. I learned many traits of the ideal soil for plant growing, but different plants need their soil to have different traits. For the most part ideal soils are loam and have a neutral pH, they also are rich in nutrients like nitrogen and phosphorus. Most of all throughout the lab I learned that all soils are different and that they are important to society.
Conclusion
Maddie Currie
During the making of this blog, the most important thing I learned about soil is that it is very important to the survival of humans and everything else on the planet. It is a home for countless microorganisms and insects. It is what we use to grow our food and without it, humans probably wouldn't survive.
Soil is not all created equal, either. Some is more fertile than the rest. The soil we tested in these experiments was not very fertile because it had low levels of nutrients. I learned why farmers use fertilizers--to replace those nutrients and make the soil more fertile. This allows them to grow more food more quickly in order to feed our growing population. Before this project, I had no idea how much organic matter soil contained. It surprised me to see that during these tests.
Soil and dirt are not the same thing. Dirt can be anything from dust to soil, but soil is special. It is made up of sand, silt, clay, and organic matter and soils from different places around the world have different characteristics like texture, porosity, composition, and nutrient content.
Soil is the living skin of our planet and one of the most important things humans need to survive.
Sunday, November 24, 2013
Controlled Experiment: Lettuce Seed Growth
Once our soil was remediated, which you can see in our Soil Remediation post, we added 6 lettuce seeds to each cup and placed them in direct sunlight.

We watered them on an as needed basis, and the chart below shows how much we gave them each day.


Our control seeds grew much more than our remediated seeds. This may be because we over fertilized the remediated crop or because we buried the seeds to far when planting the remediated crop because the soil was wet and difficult to work with.
The control crop sprouted 6 stems of lettuce with 2 leaves on them each. The remediated crop sprouted one very small stem, as shown below.

We didn't taste the lettuce ourselves, but a member of another group did and reported that isn't tasted like grass, which may be due to the fact that the lettuce plants are still so small.
Thursday, November 14, 2013
Fertility Analysis
To further understand the the composition of our soil, we looked at the pH and the levels of phosphorus, nitrogen, and potassium present in our soil.

For the pH test, we mixed pH indicator solution and soil together then let it settle for 10 minutes.

The results of the pH test and the color chart. The top part of the liquid with a bluish-greenish color is what is being compared to the chart.
The pH of our soil was about 6.5, which is just slightly acidic. The ideal pH for grass, which is what mainly grows where this soil was taken from, is between 6.5 and 7. The grass growing in this soil looks healthy, as you can see in our Collecting the Soil post, which makes sense because the pH is right on target.
For the phosphorus test, we mixed soil with Phosphorus Extracting Solution and let it settle. We then used a pipettes to take the clear liquid from the top of the test tube and mixed it with Phosphorus Indicator Reagent. Then one Phosphorus Test Tablet was added and mixed in until it had completely dissolved. The result was compared to the color chart to find that our soil's phosphorus content is lower than the ideal range.

The phosphorus results and color chart.
For the nitrogen test, we mixed soil with Nitrogen Extracting Solution and let it settle. We then used a pipettes to extract the clear liquid from the top and mixed that with Nitrogen Indicator Powder. It was then left to settle and develop for 5 minutes. We found that our soil's nitrogen content was low.

The results of the nitrogen test and the color chart.
For the potassium test, we mixed soil with Potassium Extracting Solution and let it settle. We then extracted the clear liquid from the top with a pipette. We had to repeat the first step in order to get enough clear liquid for the test. We added a Potassium Indicator Tablet to the clear solution and mixed until it had completely dissolved to get the initial purplish color.

We then added Potassium Test Solution to the test tube two drops at a time and mixing in between until we saw the color change from purple to blue, as shown below.

It took 18 drops to get the color to completely change from purple to blue. This means that our soil has a low potassium content.
Soil Moisture
For this test, we used a piece of aluminum foil, about a square foot in size, to make a small tray by rolling and flattening the sides and folding over the corners. We then weighed this tray and found that it was 2.9 grams. We added several spoonfuls of soil to the tray and weighed it again, finding it to be 86.9 grams. This means that the weight of the soil alone was 84.0 grams initially.
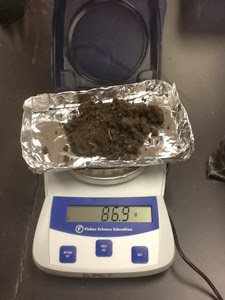
The soil was then placed into a drying oven overnight at 90-95 degrees and retrieved in the morning. The pictures below show the difference in the appearance of the soil.
Before drying oven:

After drying oven:

The weight of the tray of soil after coming out of the drying oven was 85.2 grams. This means that there was 1.7 grams of water in the soil.

Calculations:

The percent of water by mass for the soil was 2.0% as calculated below.

This is a relatively low percentage of water content in the soil compared to other groups in the class, who had as much as 12% to 13% water.
These values accurately represent our soil because of its composition, which was 40% sand, 50% silt, and 10% clay. The other groups that had higher water percentages had much more clay in their soil and much less sand. Sand doesn't hold water very well and allows it to go right through it, and clay holds water very well.
Wednesday, November 13, 2013
Berlese Funnel
In our Berlese Funnel lab we were performing a test to find macro-invertebrates in our soil. To preform this lab we cut the top off of a two liter bottle and placed a filter on the outside of the mouth of the bottle which was then securely taped on. Some ethanol was placed in the bottom portion of the bottle and then the top portion of the bottle was filled with soil, placed on the bottom part, and finally placed under a heating lamp.

This is our set up Berlese funnel. It has been placed ten centimeters under a heating lamp where it will stay for five days, being under the heat lamp will cause the soil to become dry and macro-invertebrates to fall out of the soil through the filter, and into the ethanol.
We found that our soil became very dry under the heating lab and that our Berlese funnel produced few organisms. Although we could see some details of the organisms we found they could not be confidently identified. Based off of other information and result of other students, we can assume it is some type of soil mite. Other lab groups that had organisms also found that they had soil mites. We did not have many organisms, but others had no organisms at all, while other lab groups found many organisms. Macro-invertebrates are important to our soil because they make soil more porous and they also assist in the flow of organic matter in an environment.

Percent Organic Matter
After we removed the soil from the drying oven we used it to preform our percent organic matter test. The soil had 20.8 grams of organic matter, which is 46.1%. We found this by weighing the recently dried soil and then placing it on a Bunsen burner for thirty minutes. After the thirty minutes we allowed the soil in the crucible to cool and then weighed it again. We then compared the weights to solve for the amount and percent of organic matter. Since we weighed the soil both before the Bunsen burner and after the Bunsen burner in the crucible, we did not need to weigh the soil alone.


This is our crucible filled with soil before it was placed on a Bunsen burner, it had a weight of 45.1 grams.
This was our crucible filled with soil on a Bunsen burner, where is was heated at a high temperature for thirty minutes.
This is our crucible filled with soil after it has been removed from the Bunsen burner, cooled, and placed on the scale, after the heating it weighed 24.3 grams.
These were our calculations for total organic material and for the percent organic material.
Organic material is extremely important in soil for many reasons. Some of these reasons are that it helps nourish the soil, it increases a soils ability to hold water, and it gives the soil better structure. It helps nourish the soil by adding many nutrients like nitrogen and phosphorus. Organic mater also assists in soils ability to hold water because it is usually a very absorbent substance. It also helps with soil structure by causing soil to clump more, which is very important in creating space in soil for substances like water and gasses.
Dry Percolation Rate
For our dry percolation test we placed 50 mL of water in each funnel full of a substance one at a time. We let the water trickle through the substance that was in the filter at that particular time. Once one minute had passed, we removed the top portion of the bottle that contained the filter from the bottom. We then measured the water that was in the bottom part of the bottle. Using the amount of water that had passed through and the standard minute, the percolation rate was solved for.


Above is the clay portion of the percolation test. The clay's percolation rate was 0.22 cm³/sec. The water flowed through the clay at a fairly slow, but stable rate. The liquid that was produced was very opaque because it picked up many of the clay particles but did not release them.


This is our sand portion of the percolation test. The sand's percolation rate was 0.2 cm³/sec. The water flowed through the sand very quickly and then after a lot of water flowed through it dripped extremely slowly. Some sand particles were picked up by the water as well w because the water is not as clear as it was when is was poured on the sand.


This is the soil portion of our percolation test. Our soil's percolation rate was 0.27 cm³/ml. The water flowed through our soil sample at a steady and medium pace. The resulting water was not quite as opaque as the clay, but more closer to the sand water in appearance, so we can make the assumption that it picked up sand like particles.
We know our soil is a mix of both sand and clay because it flowed at a faster rate, like the sand percolation, but it also flowed at a standard rate, like the clay percolation.
Soil Porosity
To measure the porosity of our soil, we filled a beaker with 200 mL of dry soil. Then we filled a graduated cylinder with 100mL of water and poured the water into the soil until it began to pool on the surface of the soil.
This short video clip shows the water being poured into the soil:


This is what the beaker of soil looked like with water pooling on the top:
There were 27 mL of water left in the graduated cylinder.
Calculations:
The soil absorbed 73 mL of water, which filled the empty spaces in the soil. This means that there was 73 mL worth of empty space in 200 mL of soil, which gives the soil a porosity of 36.5%.
One observation we made was that the soil became more compact once we added the water. Below is a side view of the beaker after the water was added.
The soil and water together only take up about 175 mL of space in the beaker. This could have caused some error in the calculations.
Soil Texture
We found that our soil had a fair mix of sand, silt, and clay. When we were judging the soil sample that we had dampened and mixed with our hands, we found that the soil was slightly sticky and not too grainy.
With our wet soil ball we were able to create a ribbon of soil that was two inches long by squeezing the ball between my forefinger and thumb. This is a fairly long ribbon and leads us to believe that the soil is heavier in clay.

A portion of our soil was mixed with water and after being allowed to sit, the larger particles separated out and settled in the order of large particle sand on the bottom, medium sized particle silt in the middle, and the fine particle clay settling on the top. After our soil sample had divided into the three levels we found that it was 40% sand, 50% silt, and 10% clay.


Our soil was a medium loam, represented by the dot.
With our wet soil ball we were able to create a ribbon of soil that was two inches long by squeezing the ball between my forefinger and thumb. This is a fairly long ribbon and leads us to believe that the soil is heavier in clay.
Soil Ribbon: about 2 inches
A portion of our soil was mixed with water and after being allowed to sit, the larger particles separated out and settled in the order of large particle sand on the bottom, medium sized particle silt in the middle, and the fine particle clay settling on the top. After our soil sample had divided into the three levels we found that it was 40% sand, 50% silt, and 10% clay.
Top Left: above the pencil is clay
Top Right: in between the two pencils is silt
Middle: the settles soil, water, and organic matter
Bottom Left: a view of the top of the graduated cylinder
Bottom Right: below the pencil is sand
Our soil was a medium loam, but other groups had soils with more silt or more clay. Over all the soil in our area is usually not too high in sand, this could be directly related to the fact that we do not have large sources of sand near by. Like many areas in the United States, our soil is heavier in clay, but depending on the area it may or may not have large amounts of silt. Most soil in our area are generally a clay, silt, or loam like mix.
Our soil was a medium loam, represented by the dot.
This short video clip shows where the different sized particles settled.
Thursday, November 7, 2013
Soil Remediation
In our fertility tests, we found that our soil had low amounts of phosphorus, nitrogen, and potassium. In the Berlese funnel and organic matter test, we found that there were not very many organisms living in it. This could be because of the low amounts of nutrients it contained. This is one correlation between the fertility of the soil and the organisms in it. Another would be the pH level in the soil. It is approximately 6.5, which is slightly acidic and may not be suitable for some organisms to live in. This soil was eventually used for growing lettuce seeds, whose ideal pH is between 6.0 and 6.7, so our soil pH was something we didn't want to affect with our changes.
When remediating the soil, we wanted to increase the levels or phosphorus, nitrogen, and potassium without changing its pH. To do this, we used Vigoro fertilizer. We chose this fertilizer because it had higher levels of the three nutrients we needed than the others provided.

The box said to use 3 tablespoons of the powder fertilizer for every 1 gallon of water. We scaled this down to about the amount we would need for our small cup and dissolved 0.6 grams of fertilizer in 20 mL of water. This mixture was then added to our cup of 150 mL of soil and thoroughly mixed together to evenly distribute the nutrients throughout the cup.
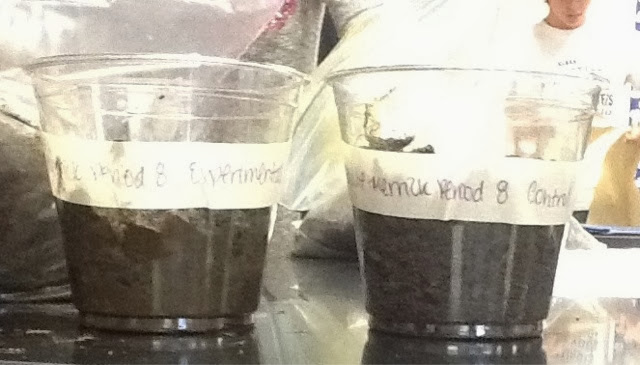
Because of the texture of our soil and its porosity, mixing water into the soil caused it to become more compact. If we were to redo this experiment, we would add the same amount of water, without fertilizer, to the control cup and mix it thoroughly as well.

The remediated soil (left) and control soil (right).
Our goal with this remediation was to allow the lettuce seed to grow more quickly than the control group. To see the results of the lettuce seed growing, please refer to our Controlled Experiment: Lettuce Seed Growth post.
Salinization
For the salinization lab each lab table produced a bag with a paper towel that had been saturated with a water and salt mixture and wrapped around five red or five white beans. Our group was in charge of bags with 1% salt solutions; we made the solution in the quantity of 120 mL so we added 1.2 g of salt to the 120 mL of water. This was then dissolved and put in bags with the beans and a paper towel to wrap the beans in. We then observed the beans of the diferent levels of salt percentage over an eight day period. We found that lower salinization levels were better for getting the beans to sprout, but a small amount of salt was still tolerable to the plant. The bags that contained water and no salt produced the best sprouts from the beans with 0.5% being the next most productive solution. After the 0.5% the salt concentration was too high and the beans did not sprout. Based on this data we can conclude that plants will grow best in an environment with no salinization. Although some salt is survivable for plants, too much will cause the plants not to grow at all, which causes many problems for occupations like agriculture. If a soil had too much salt in it one might try adding more organic matter to balance out or dilute the salt; however, the best fix for it is to remediate the soil so that the water does not travel through it too fast and strip the soil in the first place and to stop the posibility of being faced with the problem.


The observations we had of our beans through out the experiment.
These were our beans, they did not have very much activity and one might have expected more of them to sprout, becuase our beans were older they might have lost their effectiveness.
These were beans from another group, though they also did not have as much activity as was expected, their red beans were more active and if our beans were more effective they may have been closer to resembling these beans.
Tuesday, November 5, 2013
Collecting the Soil
The soil was collected from an area that has trees and grass around it. These could influence the soil by using up some of the nutrients in it. 
(There is a tree directly to the right not shown in picture.)
The soil was relatively moist when it was collected. There was a large number of rocks throughout it that we're fairly large in size, some as big as an egg. Other abiotic factors in the soil included small pieces of wood and roots. Biotic factors in the soil included many worms and insects such as rolls-poly bugs. 
The particles seemed to be mostly large to medium in size, which would indicate that the soil contains a lot of silt and sand. The color of the soil is a rich dark brown. It's texture is slightly gritty but it will easily compress into a ball.
The holes the soil was collected from was about 12 inches deep. 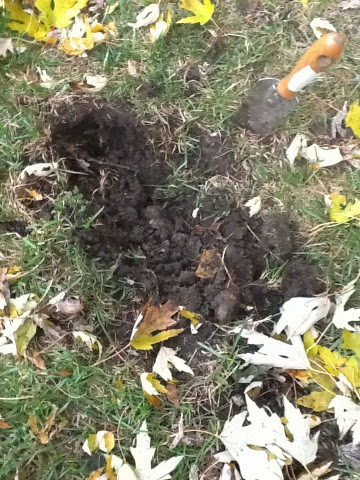
Monday, November 4, 2013
Introduction
Soil is the living skin of our planet, it is made of clay, silt, sand, organic materials, gasses, and nutrients. Soil is what the ground is made of, it is an important part of every ecosystem because organisms like plants depend on it for nutrients, but soil is not dirt.
Dirt is a general term for every thing from dust to soil, and soil is so much more. Soil is formed by a parent material, for example a bedrock, being worn down by weathering and erosion over time. This worn parent material mixes with organic materials and with the affects of the type of parent material, the influence of living organisms, topography, and time becomes soil.
Soil has many important traits like texture, color, structure, and pH. Soil texture is the composition of the soil in terms of what percents it is clay, silt, or sand. Clay heavy soils will hold water more tightly, making it difficult for the plants to use the water, while in contrast sandier soils will not be able to hold water. The best soils have loam, which is a proper mix of clay, silt, and sand. A soil's color tells you how nutrient rich a soil is. If a soil is a darker richer color it will have a higher mineral density and will therefore be better for growing plants in. A soils structure is how clumpy or campact the soil is and how much gas it can hold, looser soils that can hold more gas are healthier. The pH of a soil is affected by leaching and the cation exchange. In the cation exchange plants exchange H+ ions for nutrients from the soil, but too much exchange, or too much leaching causes soil to become acidic, which damages plants.
Typical soils of our area have a dark brown color, are clumpy, and mostly consist of clay and silt with smaller amounts of sand. Hawaiian soil is very similar to ours, it is heavy in clay and silt and has a medium acidity, it also is clumpy and is a dark reddish brown. In contrast with Hawaiian soil, Arizona soil is very basic and heavy in alkaline. Arizona soil also has very high amounts of clay, is more compact, and has a light pink, tan, or grey color. Georgia soil is also heavy in clay and compact, but it also appears a red brown due to oxidization. Although similar all of these soils are differents and distinct to their region.
Because of these differences in the soils of each region, it is important for farmers to properly analyze their soil before planting in it. Soils with more loam and higher nutrient density are better for growing crops. Understanding the soil in their specific areas can help farmers save money by using only the fertilizers and pesticides needed for that area and in smaller amounts. This creates less fertilizer runoff into rivers and streams and decreases pollution, in turn helping the environment and everything that lives in it. Analyzing soil also allows farmers to make their land more productive by rotating crops and planting more than one species in a field. This makes the crops more sustainable and less prone to invasive species while preventing deforestation for agriculture. A proper analysis if soil can help a farmer become more environmentally sustainable and economically efficient.
Subscribe to:
Comments (Atom)